
TBornotTB is a project that aimed to better understand how tuberculosis (TB) develops in individuals and spreads in populations. For a public health threat that has caused over two billion deaths in human history the so-called natural history of TB has remained stubbornly elusive. The classic paradigm of TB natural history typically accounts for two distinct stages of infection and disease, and one-way progression between them. However, data has shown that individuals can actually experience disease across a spectrum intensity, which varies over time.
If we want that knowledge to help make better decisions and reduce the burden of TB, we needed data-driven estimates of what the relevant disease states are, how many people are in them, how fast they move between states and how much they contribute to transmission. In the EU-funded TBornotTB project we worked through those questions systematically.
TBornotTB had two main objectives. First to bring together old and new data to understand how the new states of TB infection and disease are. Second to use mathematical modelling tools to show the consequences, which should help improve TB policies. In addition, we explored the role of non-symptomatic transmission in other diseases, including COVID-19.
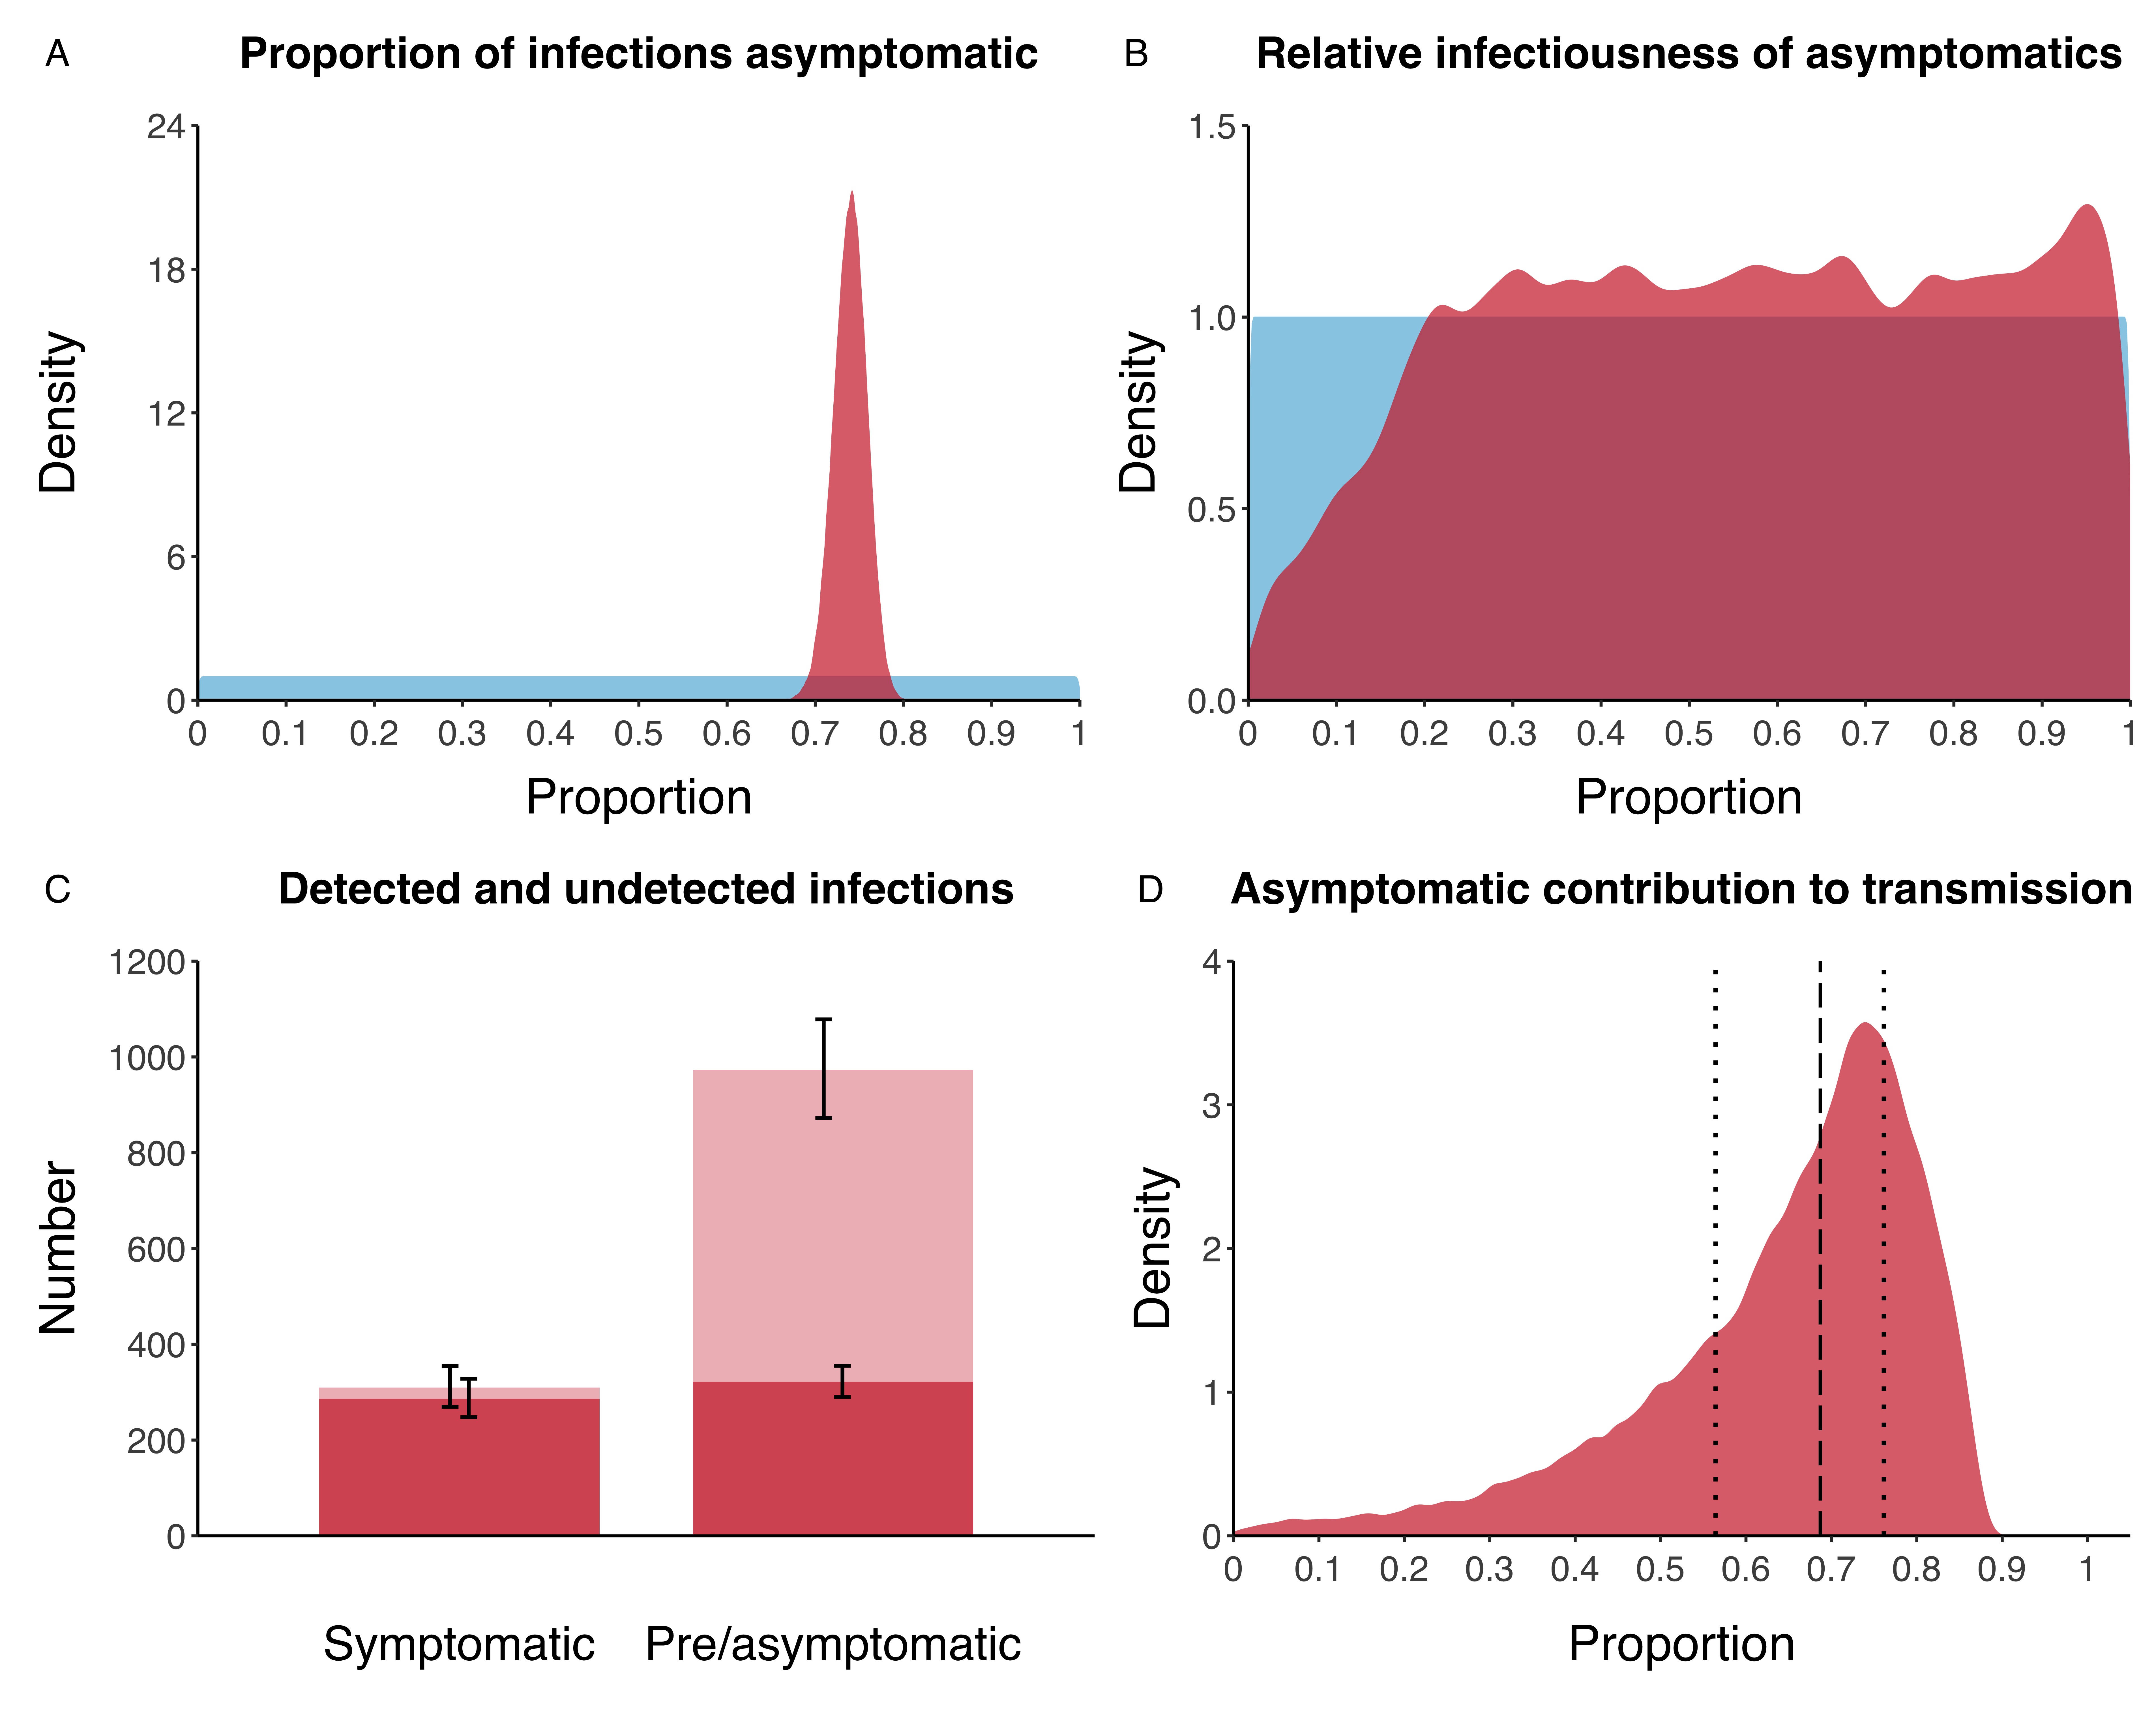
Early results from our work showed that around half of individuals who can transmit the disease, do not have, or are not aware of symptoms (which we call ‘subclinical disease’), as illustrated in figure 1. In addition, we have shown how some people recover from their infection without ever getting TB disease or treatment (which we call ‘self-clearance’). During the COVID-19 pandemic, we applied our learning from subclinical tuberculosis to asymptomatic SARS-CoV-2 infections. We re-analysed data from the Diamond Princess outbreak, and showed that over two-thirds of infections were asymptomatic, and may have contributed substantially to ongoing transmission (see figure 2).
Figure 1
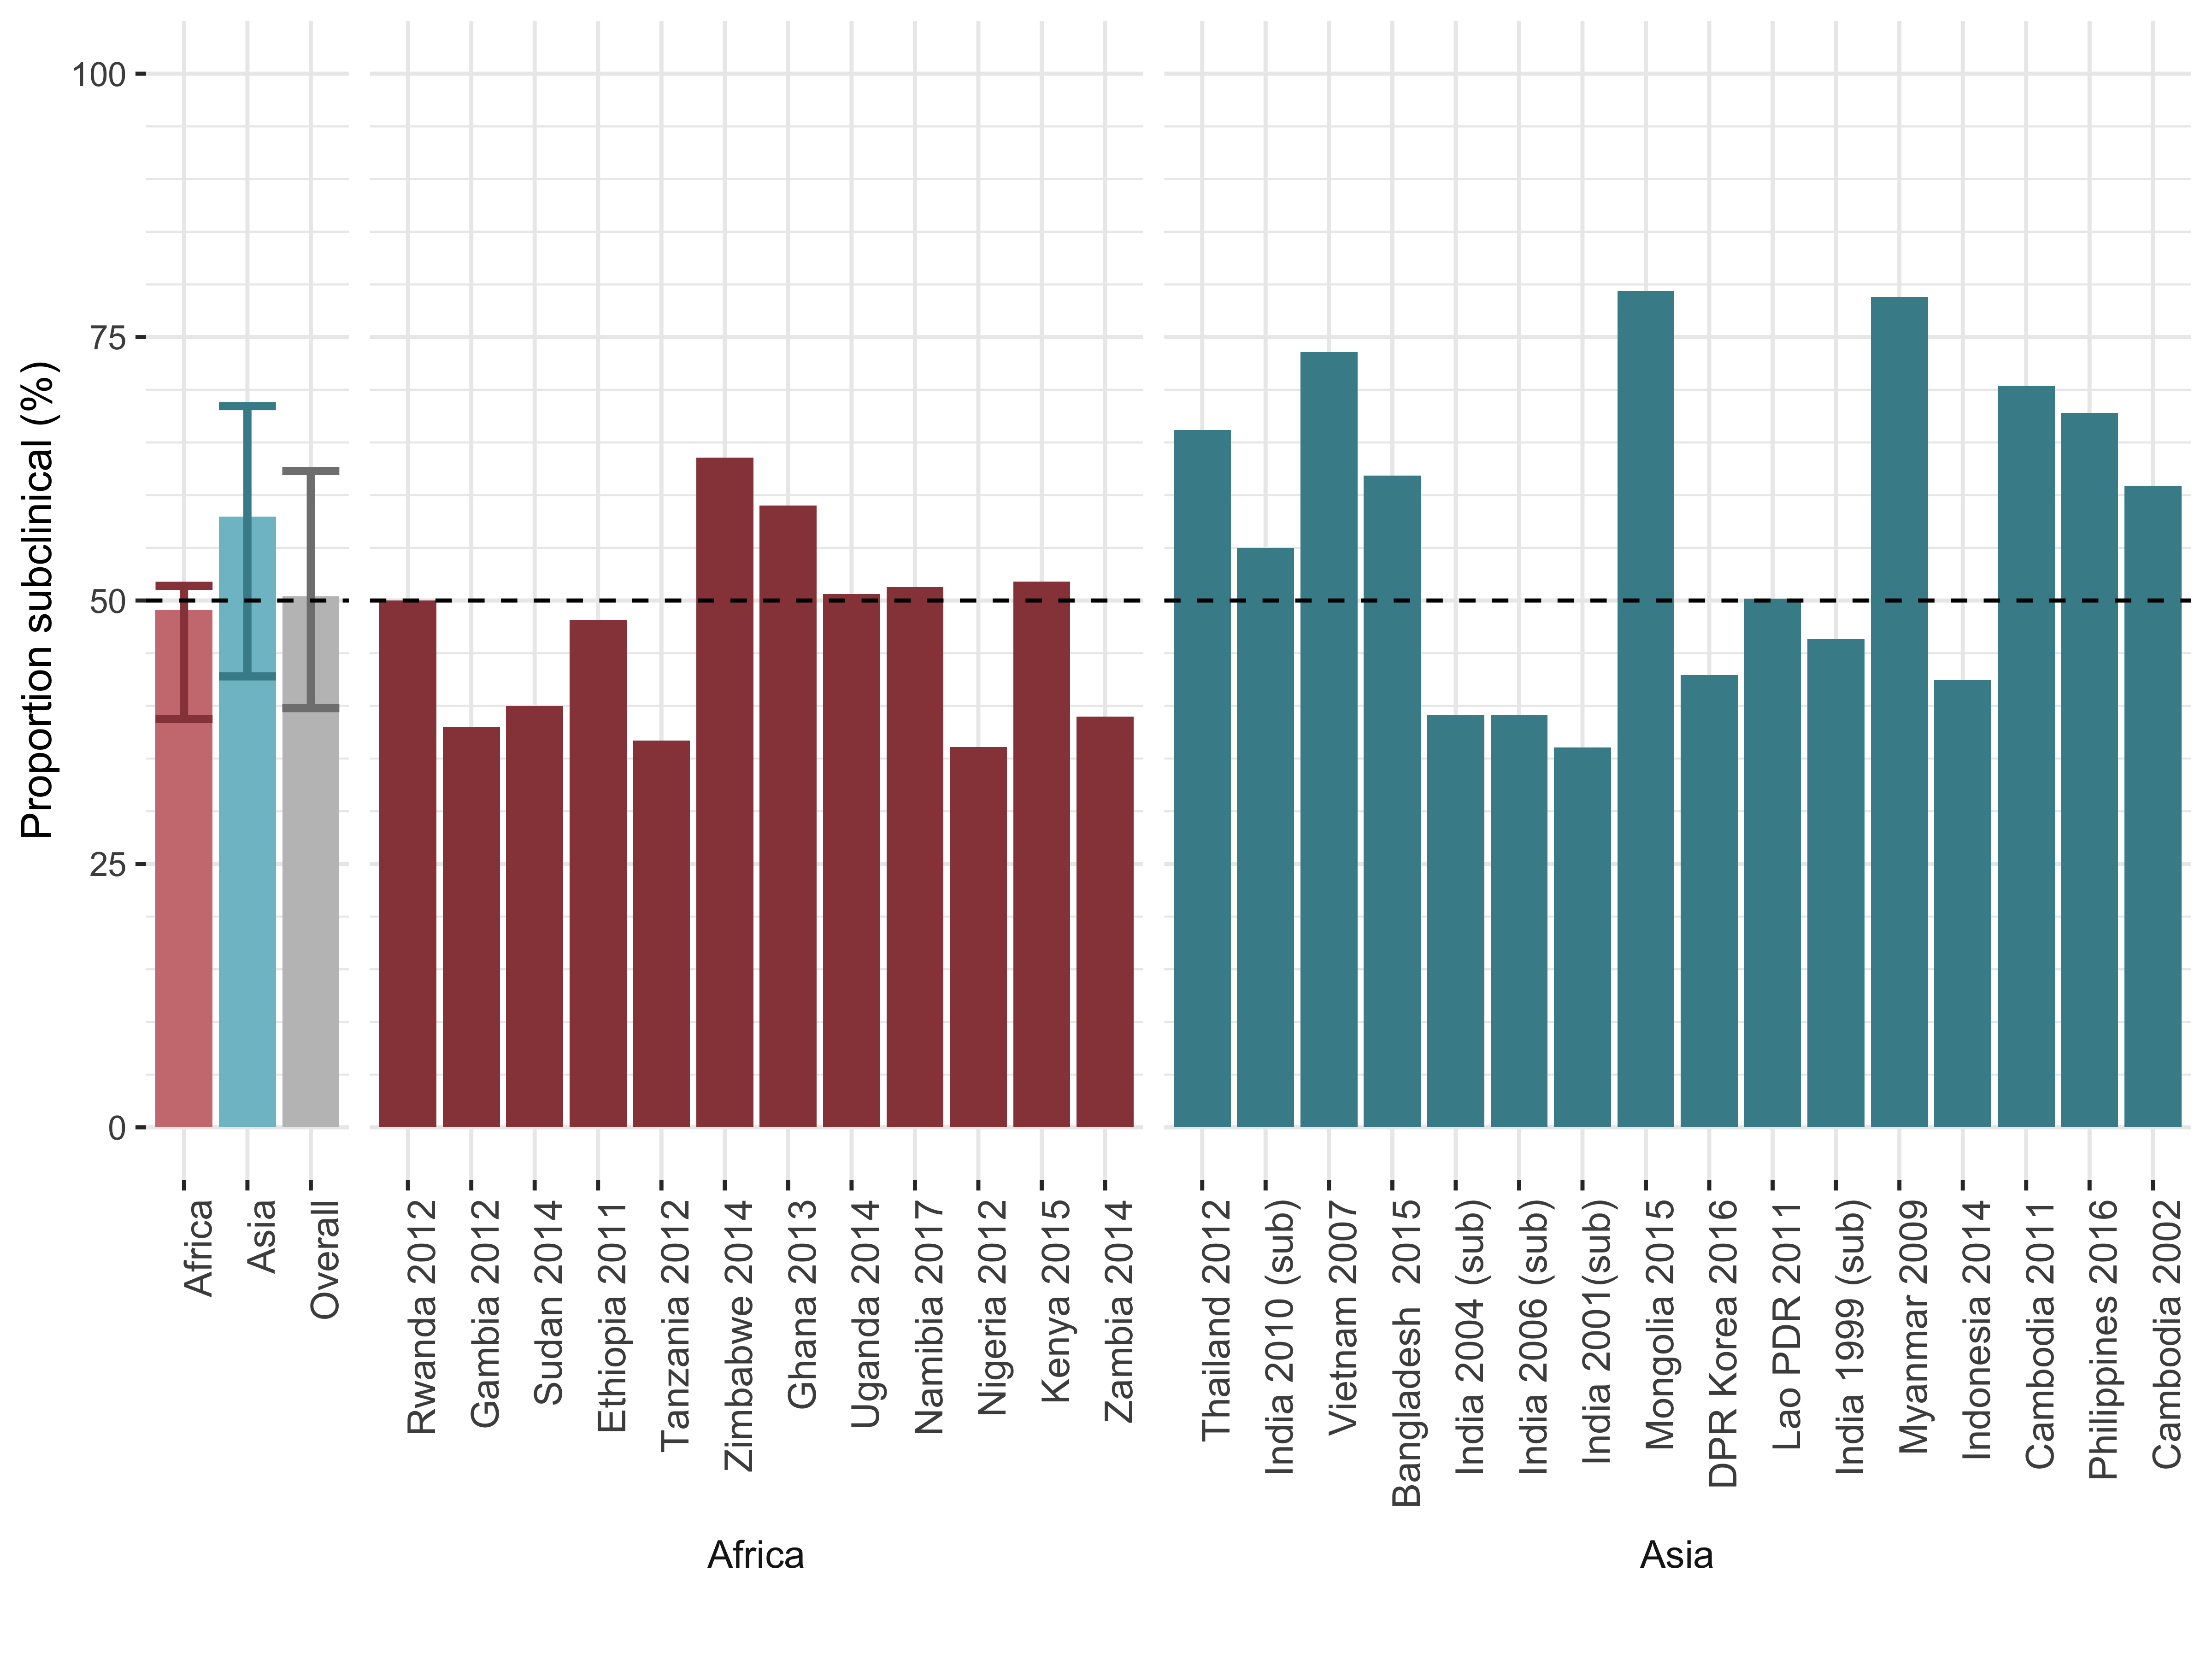
Figure 2
Building on that experience we then looked at historical and contemporary data. The historical data was from 1905 up to the 1960s (a lot of time in libraries) because in those days there was no treatment. While tragic for the many people who suffered from TB, we could see how TB developed over time, and whether people recovered without treatment. The contemporary data were from prevalence surveys, massive studies where tens of thousands of people are screened for TB, which allow us to see 1) how big the iceberg really is and 2) how much transmission was coming from individuals who had TB, but did not have symptoms.
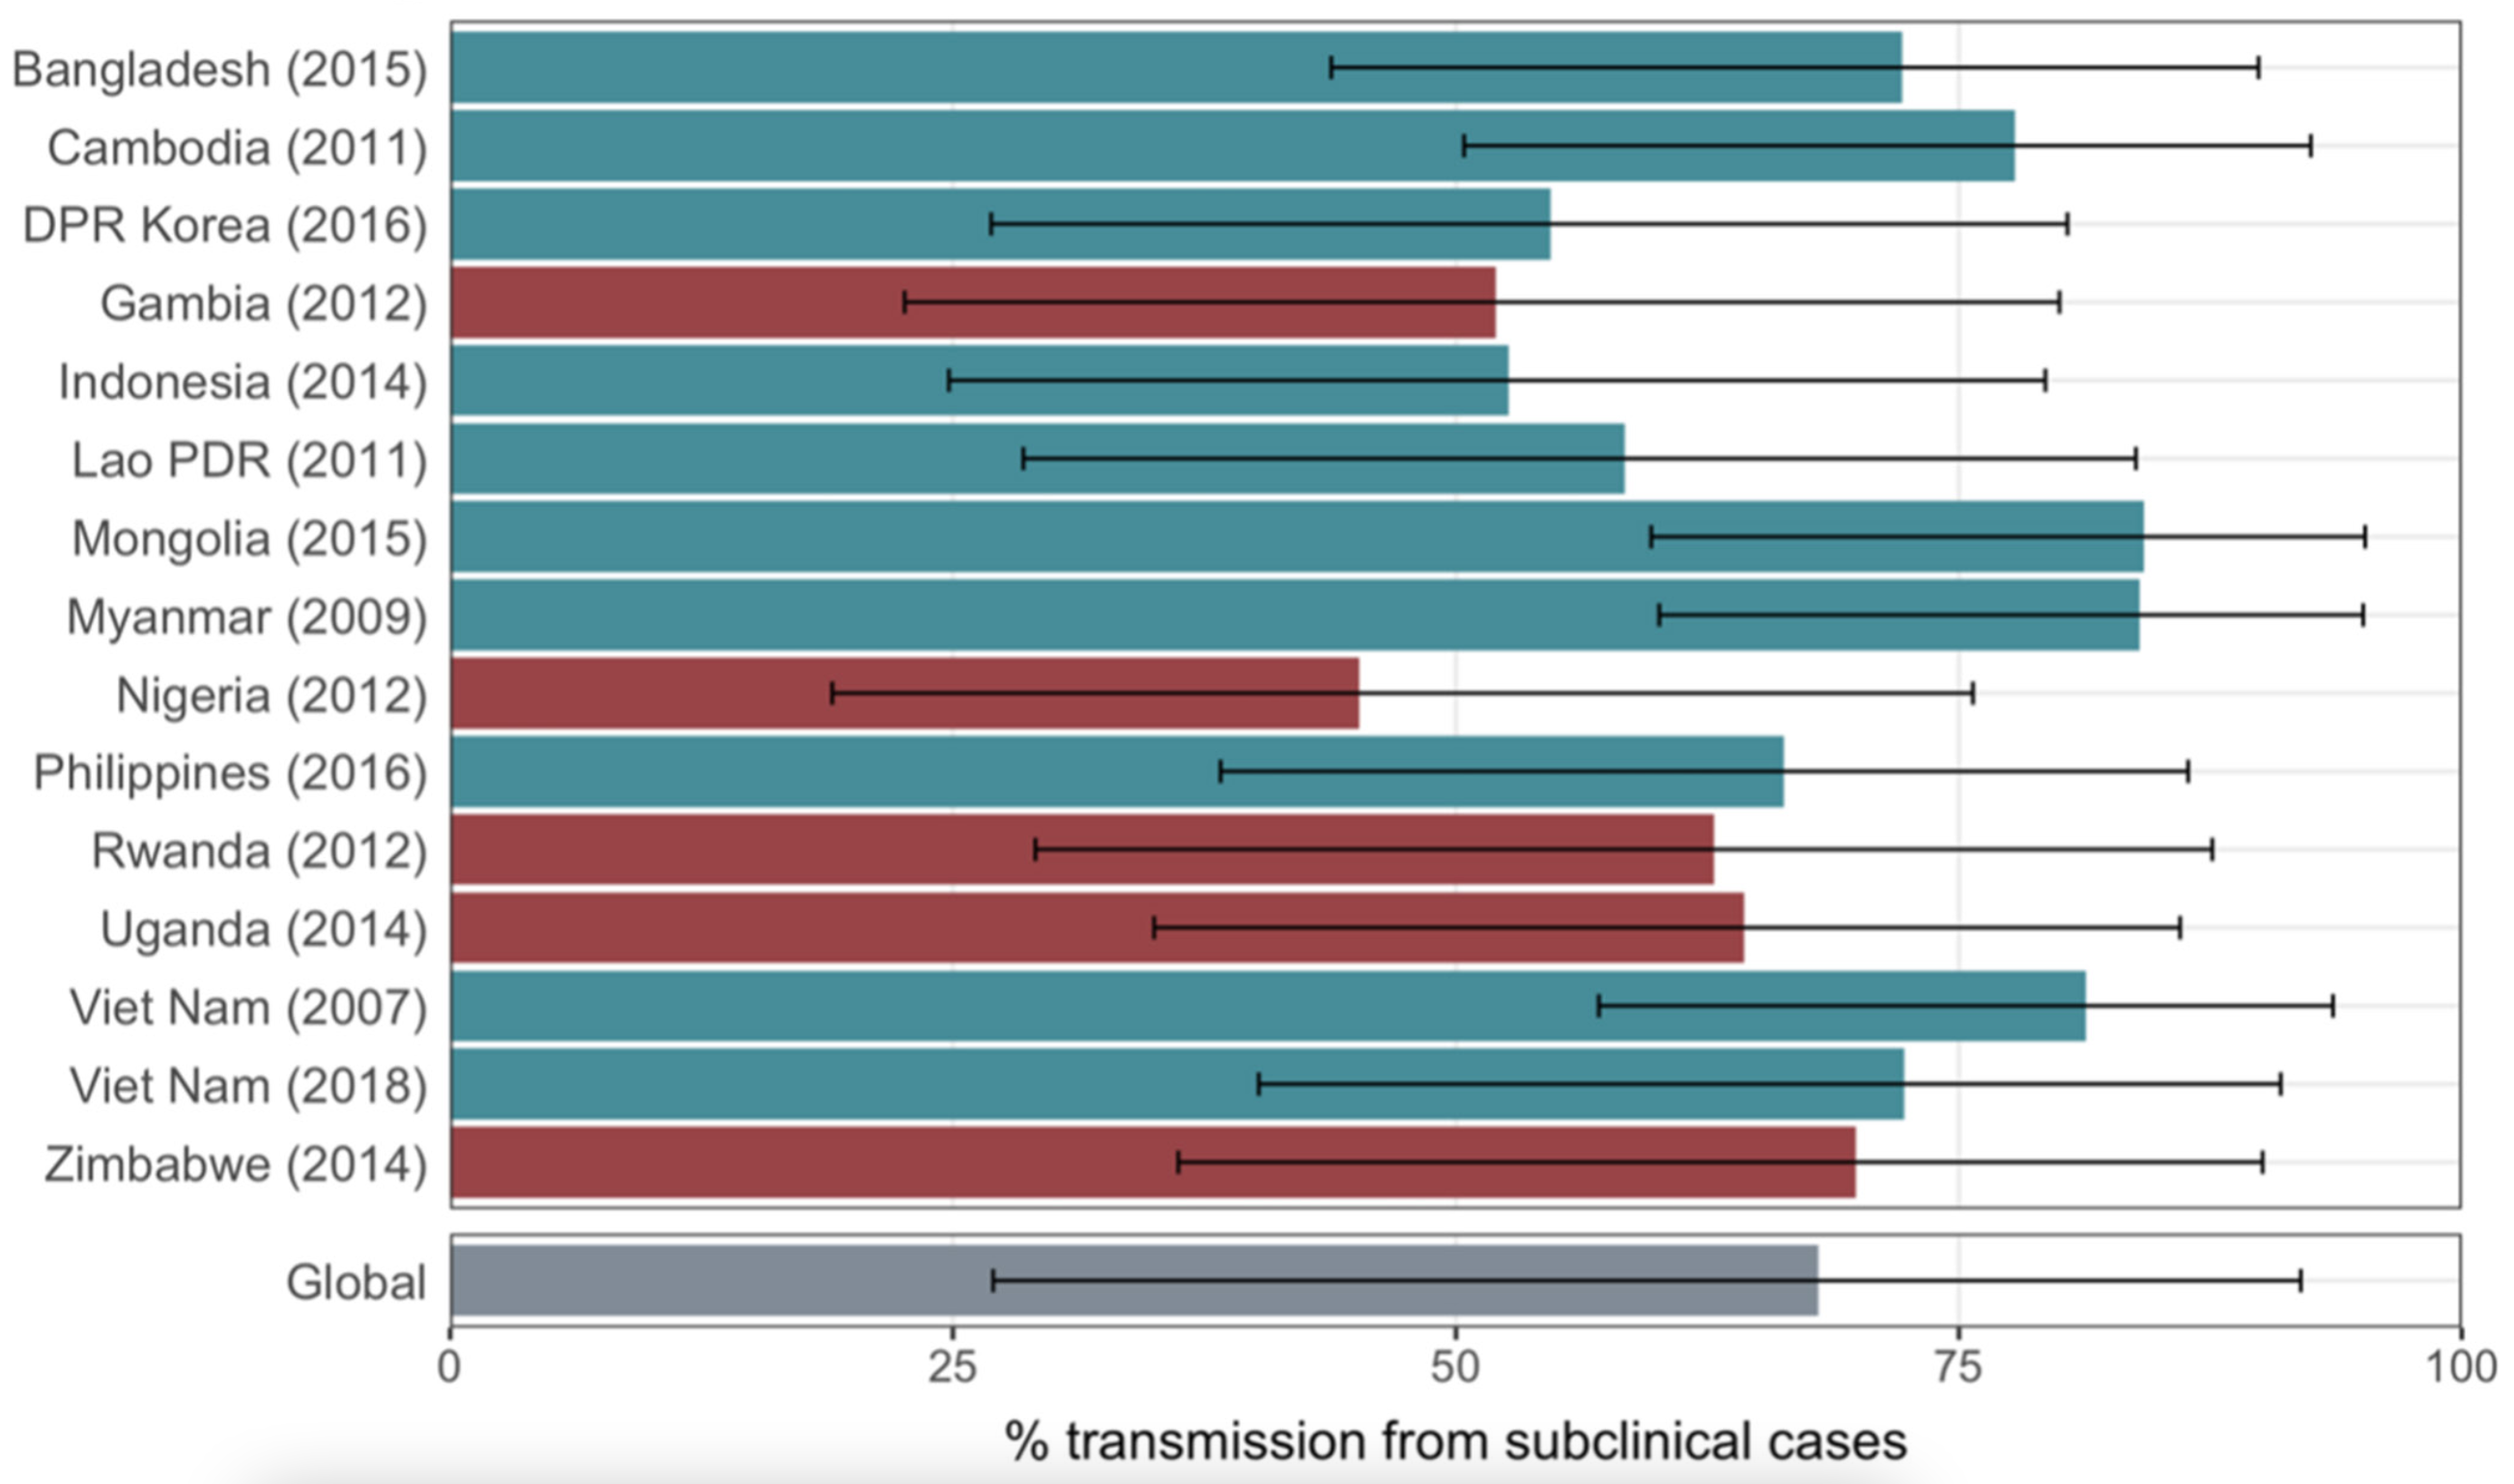
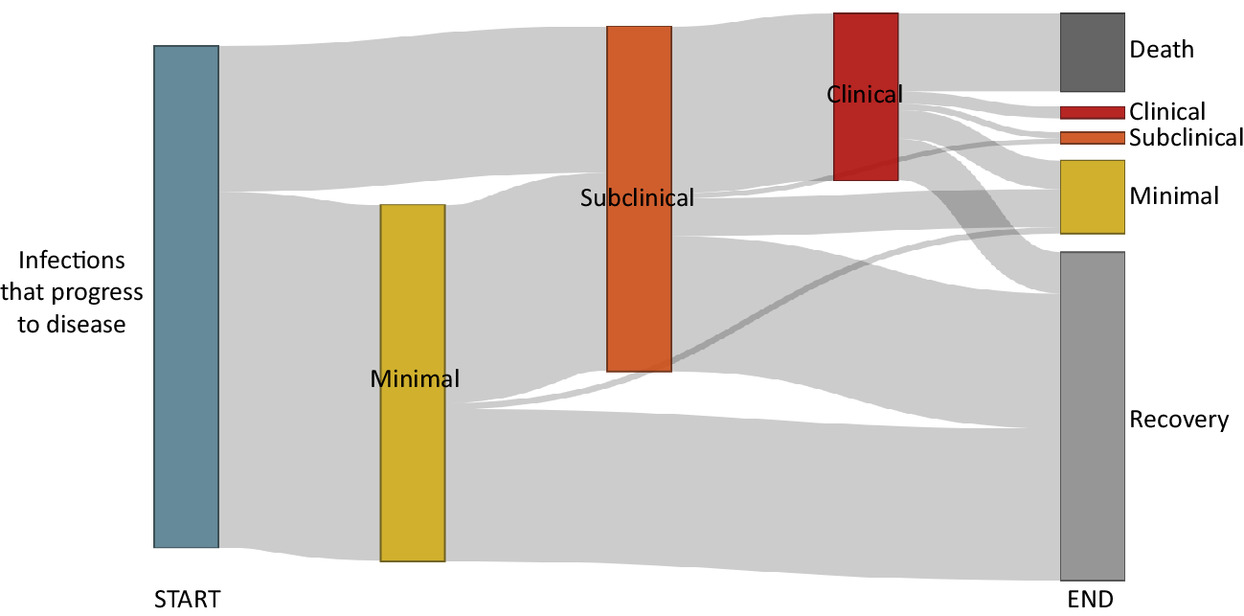
Together, these data showed that once people are in a specific disease state, they are likely to move around the spectrum, even without treatment (figure 3) and that individuals with so-called subclinical TB (not aware of symptoms) almost certainly contribute to transmission (figure 4).
Figure 3
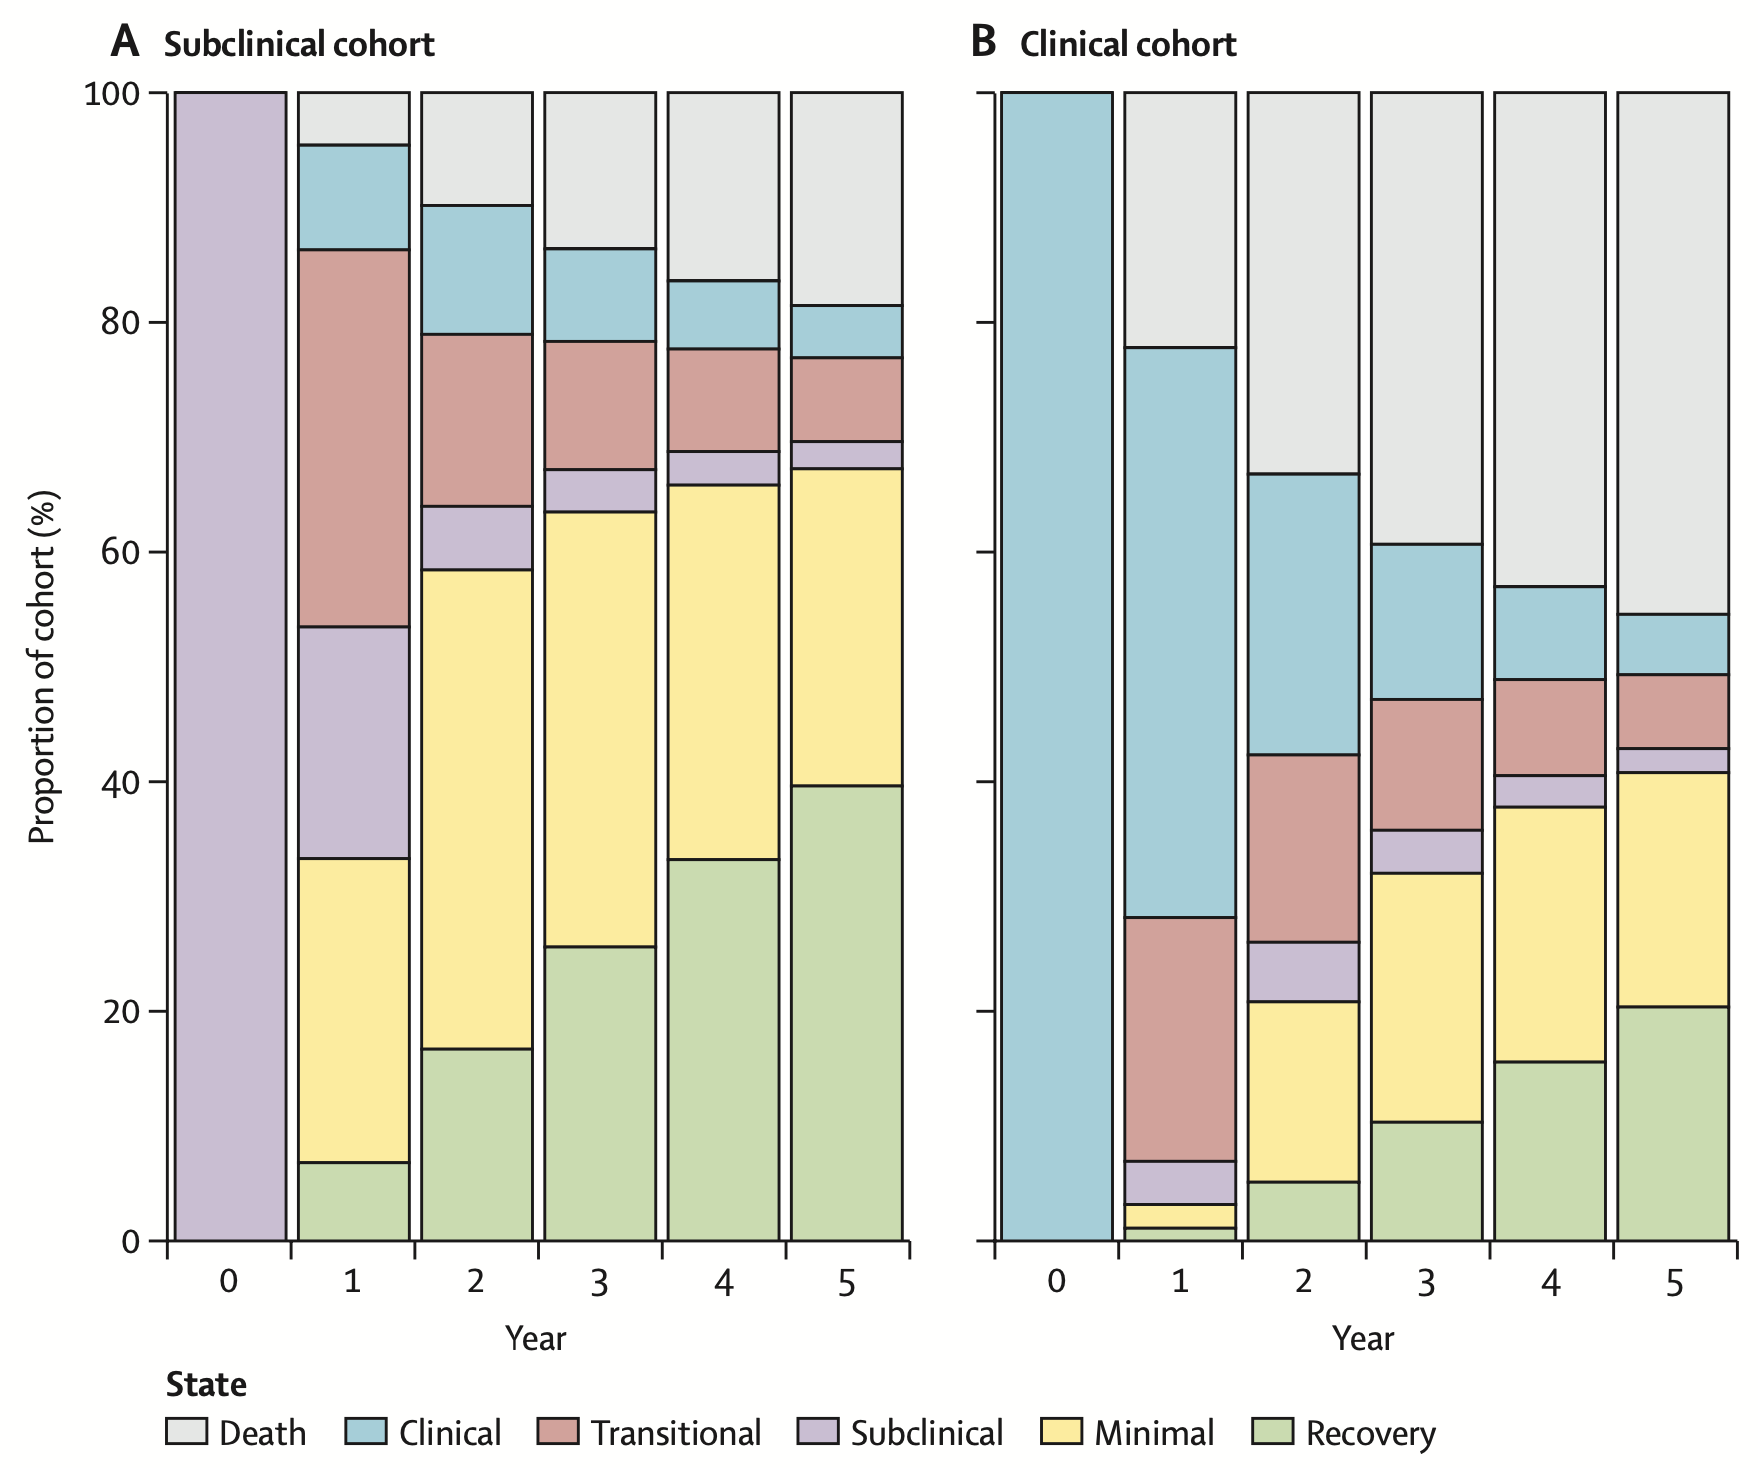
Figure 4
A final step was then to consider the entire spectrum of disease pathways following infection. When putting the data together, we found that only 1 in 10 of individuals who get infected develop TB. The model suggests that while over half of individuals with TB will develop classic clinical disease with symptoms, this is often preceded by a long period of disease (figure 5).
Figure 5
With these insights we are now working to explore the implications for TB burden, policies and the potential impact of community-wide screening interventions. These findings are in progress, and will come out over the coming year.